A Cartographer’s Perspective on the Closure of Village Schools: The Case of Metsküla Primary School
Automatic Translation by ChatGPT
Every Topic Can Be Approached with a Map
GIS Day 2023
Although one could argue that any topic can be approached with a map, it is not always necessary or justified. However, some issues demand a spatial-data-based perspective, and one of those is regional policy decisions—such as the question of closing village schools.
At the 2023 GIS Day (Geography and Geoinformatics Awareness Day), Regio’s Püü Polma gave a presentation on how a cartographic and geoinformatics-based approach can provide unique insights into such decisions, using the case of Metsküla Primary School as an example. As the presentation offers valuable insights for a broader audience, we are now sharing it on Regio’s blog.
Introduction
My name is Püü Polma. I graduated from the University of Tartu with a degree in geoinformatics and cartography and now work at Regio—one of the few private companies in Estonia dedicated to this field, with over 30 years of experience in collecting, processing, analyzing, and presenting spatial data.
The goal of my presentation is to demonstrate the additional perspective that a spatial-data-driven approach can bring to complex topics. I will illustrate this using the example of Metsküla Primary School, a small rural school facing closure.
I chose this topic because I am personally connected to it and have already conducted several analyses and created maps on the subject. I’m happy to share this material with you.
Let me state up front that this presentation does not aim to provide a comprehensive, objective overview of the closure debate. Instead, I will focus on selected aspects that fit within the spatial data context. Also, since I have a personal connection to the school, I cannot present myself as an entirely neutral observer. Nevertheless, this does not diminish the importance of the facts and findings revealed through the data.
I take full responsibility for the accuracy of the data and the analytical methods used. All underlying datasets are publicly available and properly cited under each map.
Why a “Cartographer’s Perspective”?
Although the presentation title refers to the cartographer’s view, most of the work involved—data searching, collecting, processing, and analyzing—actually falls under geoinformatics. It can be difficult to draw a strict line between the two fields, which for me are tightly intertwined.
Still, I prefer to identify as a cartographer to bring more attention to this discipline. I’ve noticed that when I say I’m a geoinformatician, the conversation rarely continues. It might sound boring or overly technical. But when I introduce myself as a cartographer, I often hear: “Isn’t that a dying profession? The whole world is already mapped! Haven’t you heard of Google Maps?”
The second aim of this presentation is to show that cartography is far from extinct and that the need to map the world from different perspectives has not disappeared. I would even claim that it is possible to approach any topic with a map. The question, of course, is how necessary or justified this always is. However, today’s topic—the closure of village schools—is one of those where spatial data analysis and map-based insights should be an essential input in decision-making.
Metsküla Primary School
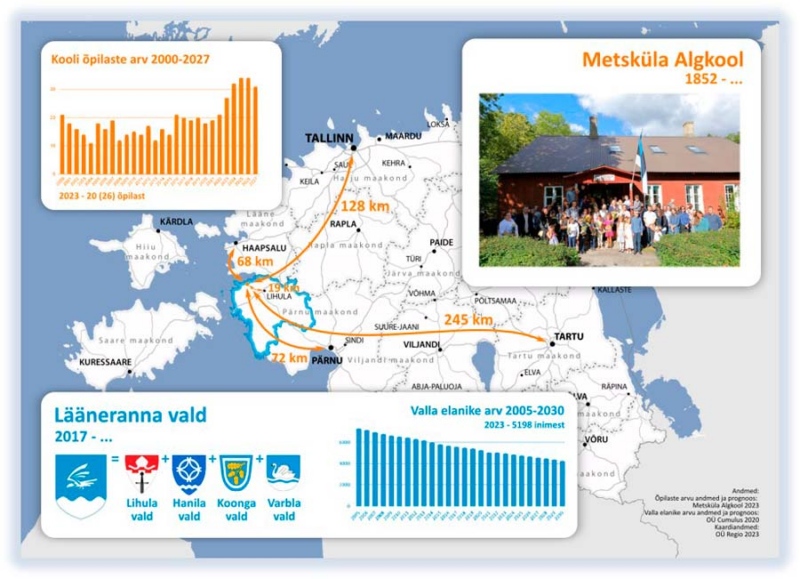
Today’s presentation revolves around the small Metsküla Primary School, which is located in western Estonia, within Matsalu National Park. The nearest center, Lihula, is about 20 km from Metsküla, and the county centers Haapsalu and Pärnu are both about 70 km away. Currently, 20 students attend this school, but without the looming closure, there would be 26 students today and over 30 in the coming years. The school is also physically small, and according to modern standards, the century-old school building cannot accommodate many more children.
Although the school is tiny, this does not mean that the number of those affected is small. The school plays a much broader role in peripheral communities than just providing education, so the number of people affected is significantly larger than just the current school community and their families.
Lääneranna Municipality
The second party in this story is the school’s maintainer—the local municipality called Lääneranna. For comparison, when Metsküla Primary School celebrated its 170th anniversary a few summers ago, Lääneranna Municipality had its 6th birthday just a few weeks ago. The municipality was formed during the last administrative reform by merging two municipalities from Lääne County (Lihula and Hanila) and two from Pärnu County (Koonga and Varbla), becoming part of Pärnu County. Thus, there is no doubt that the recent administrative reform has played a significant role in this story.
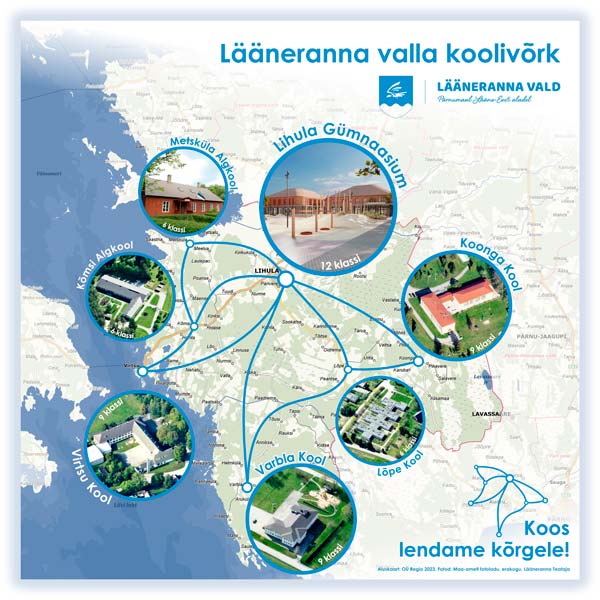
The School Network of Lääneranna Municipality
The map shows the school network that the new municipality inherited from its predecessors. For the first four years, this network was protected by the merger agreement. The aim of this map was to illustrate the school network and emphasize the importance of cooperation between schools.
One interesting observation during the creation of this map—one can never know what perspective might emerge simply from placing spatial data on a map. After plotting the school locations and drawing connections between them, a butterfly shape unexpectedly appeared on the map. It fit the context so well that the map received a clear title: “Together We Fly High!”
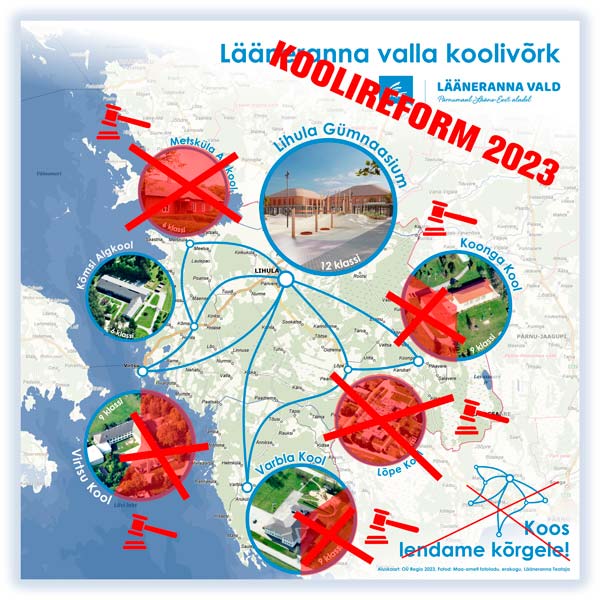
Lääneranna Municipality School Reform
That same map also illustrates the problematic situation within the municipality. In March of this year, the municipal council decided to implement an extensive school reform—closing two of the seven schools (Lõpe and Metsküla), reducing the number of grades from nine to six in two schools (Koonga and Varbla), and cutting classes from nine to four in one school (Virtsu).
An alternative proposal—to scale back one school (Lõpe) only, from nine to six classes, and establish a municipality-wide “education cooperation council” with outside experts—was rejected by the council.
The Reform Proponents’ Case
The main justification was that the school network needed to reflect a declining student population and free resources to strengthen the municipality’s borrowing capacity. This is necessary because the Lihula Gymnasium building in the municipal center is in such poor condition that a new school building is needed. (Note: The gymnasium building shown on the map exists only in plans). Another reform goal is to raise teacher salaries in the remaining schools, which proponents argue will improve education quality, a concern outlined in the reform proposal.
The Reform Opponents’ Case
Because this form of reform contradicts national, county, and local development plans, as well as the coalition agreement and pre-election promises of the ruling party, it’s unsurprising that many in the community are against it.
Parents from all five affected schools challenged the decision in court. They argue that the analyses in the reform proposal were flawed, biased, and sometimes even based on incorrect data. They also assert that the communities were not included in the decision-making process.
Many residents believe that the reform will not only harm the affected areas but also lead to depopulation across the municipality—through the departure of active people, community dissolution, a weakening of civil society, and hindered inter-municipal cooperation.
Using my butterfly metaphor: people fear that this butterfly with clipped wings will not be able to fly high.
Contradictions in the Arguments Regarding Metsküla Primary School
A closer examination of Metsküla reveals that the municipality’s main arguments lack basis:
- This is not a school with a declining or small number of students.
- There are no major problems with maintaining the school building—in fact, it’s among the most cost-effective per-student facilities in the region, comparable to others.
- No issues with education quality have been observed.
Metsküla Primary School – Cost or Revenue for the Municipality?
The first analysis shows that Metsküla Primary School is not merely a cost—it also generates revenue. Due to the threat of closure, many local residents came forward, stating they moved to the municipality specifically because of the school. When we totaled their tax contributions to the municipal budget, we found that their incomes cover the school’s operational costs. With the municipality spending about €40,000 annually on the school and receiving over €2,000 per resident per year, just 20 such taxpayers cover the school’s costs. In fact, approximately 40 individuals stated they reside in the municipality specifically due to the existence of the school.
1408(1) x 0.1196(2) x 12(3) = 2020.76 €/a
(1) Average gross monthly income of the region
(2) Municipal tax rate
(3) 12 months
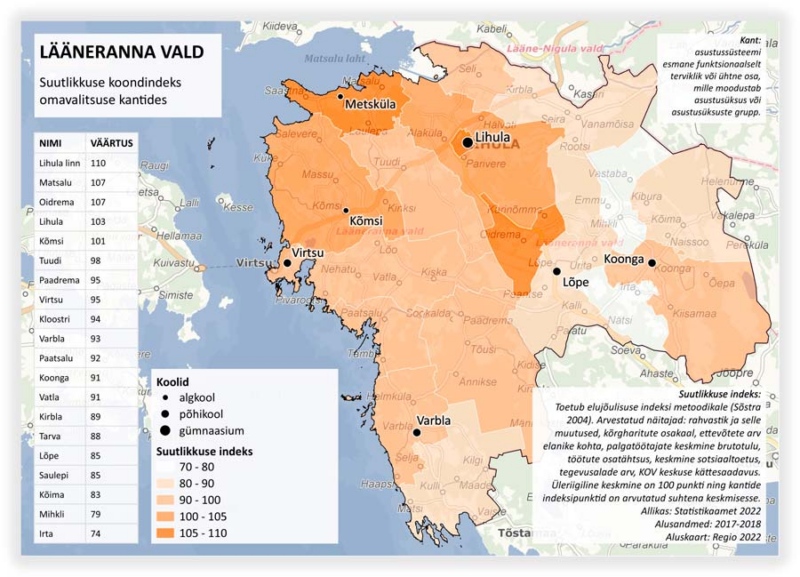
Given that the claims made by community members on this topic are often met with skepticism—and recognizing that people less familiar with life in remote areas may find it hard to believe that the mere existence of a school could so significantly influence people’s choice of residence—I set out to find spatial data that might support this assertion.
I discovered that Statistics Estonia has developed an indicator called the Capacity Index to describe the development potential of different regions in the country. This index combines several important metrics, such as income per capita, unemployment rate, share of highly educated individuals, number of businesses per capita, demographic data, etc. According to this index, the Matsalu area surrounding Metsküla Primary School ranks as one of the most capable regions in the entire municipality.
Considering that many of the children attending Metsküla Primary School actually live farther away from the school itself, and that several residents who moved to the municipality because of the school don’t live in the Matsalu area specifically, the school’s positive financial impact on the municipality may in fact be even greater than it appears on the map.
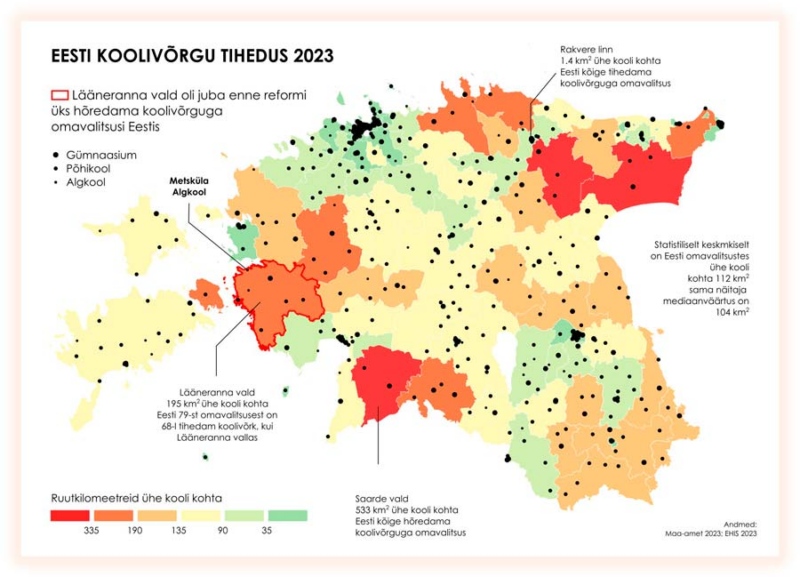
School Network Density
The inspiration for this map came from Lääneranna Municipality’s leading education official, who repeatedly made a statement along the lines of: “We only have 400 children but 7 schools – that’s not normal, that’s not sustainable.”
Such a statement is completely removed from its spatial context and needs to be balanced with another perspective, something like: “We have 1,400 square kilometers and only 7 schools – that’s not normal, and it doesn’t allow for adequate access to education.”
To illustrate this latter point and to allow for comparison with other municipalities, a map of school network density in Estonian municipalities was created. This map shows that even before the education reform, Lääneranna already had one of the sparsest school networks in Estonia. In the municipality with the densest school network, there is one school per 1.5 square kilometers; in Lääneranna, each school covers nearly 200 square kilometers.
The map also highlights that one municipality in Estonia has a school network more than twice as sparse as Lääneranna – Saarde Municipality. It should be noted that the draft decision for the school reform did include some spatial analysis, but it focused primarily on a comparison between Lääneranna and Saarde. This sparked further interest in exploring the issue more closely.
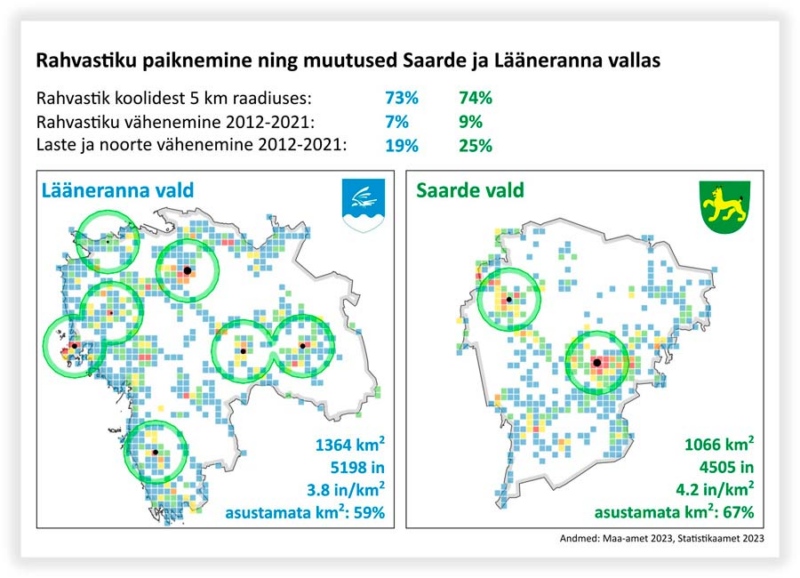
Comparison of Lääneranna and Saarde Municipalities
Lääneranna Municipality is somewhat larger than Saarde Municipality in both area and population, although the overall scale is similar. When comparing the population data of the two municipalities, one notable difference emerges: in Saarde, the population is more concentrated around central settlements, and there are more uninhabited areas. In fact, 67% of Saarde’s area is uninhabited, compared to 59% in Lääneranna.
Even more striking, when looking at the numbers: 74% of Saarde’s population lives within a 5 km radius of one of its two schools, while only 73% of Lääneranna’s population lives within 5 km of one of its seven (formerly existing) schools.
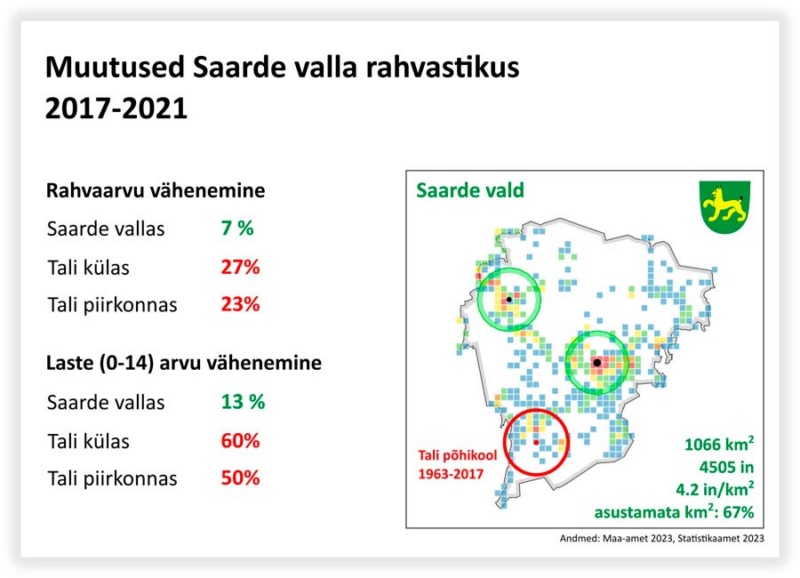
Changes in Saarde’s Population After the Closure of Tali School
On the map of Saarde Municipality, it becomes clear that although the southern part of the municipality is more densely populated, there is no school located there. It turns out that Tali Primary School, which was closed in 2017, used to operate in that area.
An analysis of population changes following the school’s closure shows that while the overall population of the municipality declined by 7%, the Tali area experienced a 23% decrease. Even more dramatically, the number of children dropped by 50% in Tali, whereas the decline in the municipality as a whole was 13%.
What Conclusions Can Be Drawn from the Comparison of the Municipalities?
First, one naturally wonders whether there is a clear answer to the classic chicken-and-egg question:
Is the lack of schools in Saarde the result of a more concentrated population, or is the population concentration (or conversely, depopulation of peripheral areas) actually the result of having fewer schools?
Second, it raises a valid concern whether Saarde Municipality, given its different population distribution pattern, is a suitable comparison model for Lääneranna at all—and whether, with its declining population and especially the rapid decrease in children and youth, it is really the kind of example worth emulating.
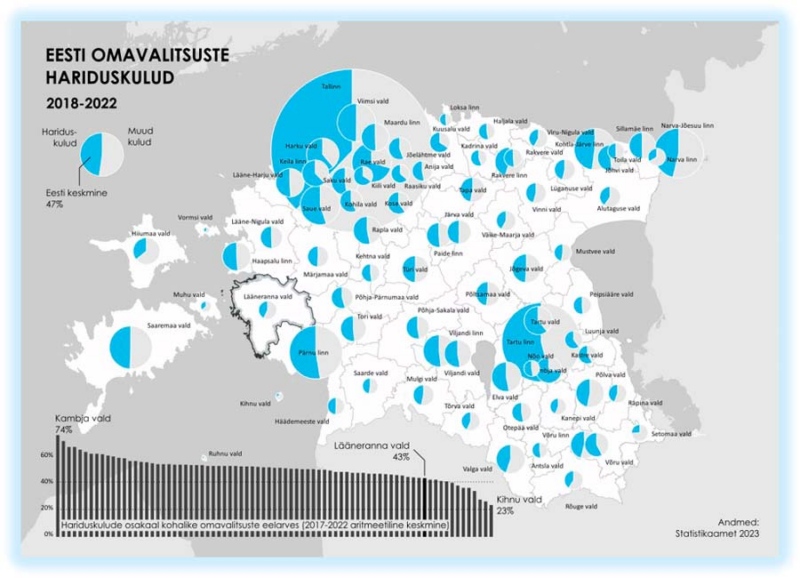
What Stands Out About Lääneranna Municipality’s Education Spending?
Time and again—especially at the local level—there’s a persistent myth that needs to be debunked: namely, the widely held belief that Lääneranna Municipality spends an unusually large share of its budget on education, supposedly at the expense of all other areas.
Taken out of context, it may indeed seem unfair that nearly half of the municipality’s budget goes to education. However, when compared to other Estonian municipalities, it turns out that Lääneranna actually stands out for its relatively modest education spending, based on the five-year average.
While the national average for education expenditure among municipalities is 47% of the total budget, in Lääneranna it’s notably lower—just 43%. And that figure includes extracurricular education, which in recent years has been significantly higher than average in Lääneranna, leaving even less of the budget for general education.
The map clearly shows the vast differences between Estonian municipalities in terms of both capacity and willingness to invest in education.
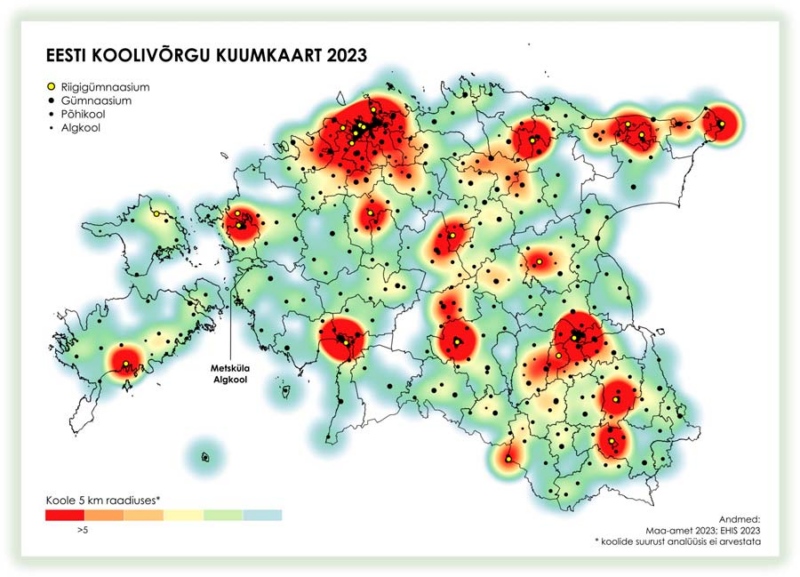
Heat Map of the Estonian Education Network
Let’s return once again to the topic of school network density—this time not through a choropleth map, but through a heat map. The map clearly illustrates the disparities in access to education and the variety of choices available in different parts of Estonia.
Pay close attention to the yellow dots on the map—they mark the locations of state-run gymnasiums. In recent years, the state has been moving decisively toward centralizing upper secondary education (grades 10–12) under state management. For remote municipalities far from these state schools—and struggling to maintain their own gymnasiums—the Ministry of Education has increasingly recommended closing down local upper secondary levels. At one point, the state even offered financial incentives for the closure of small rural gymnasiums.
Now imagine if Lääneranna decided to shut down Lihula Gymnasium—this would mean that students in Metsküla (and almost everywhere else in the municipality) would be forced to move away from home after completing 9th grade in Lihula. The nearest state gymnasiums are about 70 km away. Slightly closer is Kullamaa Secondary School (50 km), but that is still too far for daily commuting and is an even smaller school—probably also at risk of closure.
Considering the Ministry’s plan to raise the compulsory education age, situations may increasingly arise where, upon finishing 9th grade, students will be legally required to leave their home area, simply because no appropriate school exists nearby.
Why Is It Important to Talk About Gymnasiums in the Context of Village Schools?
Drawing attention to the challenges of rural gymnasiums is extremely important when discussing the preservation of village schools. It helps us understand the desperate efforts of local governments in remote areas to find ways to keep the upper secondary level (grades 10–12) alive in their communities.
At the same time that the parents of Metsküla Primary School students are fighting to save their school, they are also fighting to preserve the gymnasium in Lihula, where their children would continue their education after finishing primary school.
This desperation has likely been intensified by the attitude of the Ministry of Education, which, in turn, may not fully grasp how important the presence of a gymnasium is to local residents. Just like with village schools, this is not only an educational issue — it’s about ensuring that life in the region can continue and develop in a meaningful way.
In their desperation, municipalities may fail to realize that it’s not possible to preserve a gymnasium by closing village schools. In doing so, they may end up shooting themselves in the foot. While short-term cost savings may appear on paper, it’s likely that in just a few years, there won’t be enough students left in the outlying parts of the municipality, and the gymnasium will still face closure.
In Conclusion
Although the school network heat map is the last map in this presentation, there are still many more aspects that could — and should — be visualized on this topic. However, one must also recognize the hard truth: there is little point in creating valuable materials if the people making the decisions don’t want to look at the data, and those who do want to see it aren’t in a position to decide.
It is truly astonishing that such important reforms and policy decisions can be made based on incomplete, biased, or even incorrect data — and that this can be legally acceptable. In comparison, decisions about major infrastructure projects require environmental impact assessments by law, yet major regional policy decisions do not require even the most basic social or financial impact assessments.
On a more positive note, I hope that this case study and the public debate it sparked will help prevent similar situations in the future. I also want to believe that we as a society are moving toward data- and analysis-driven decision-making, and that the field which brought us here today — geoinformatics and cartography — will have a central role in that future.

